- Overview
- Patient Experience
- Mother & Baby
- Hip & Knee
- Patient Safety
- Healthcare Acquired Infections (HAIs)
- Emergency Department (ED) Care
- Heart & Lung Conditions
- Stroke
- Psychiatric Care
- View All
See ratings on health care quality in hospitals, why quality matters to you, and how you can help get the care you need and deserve.
Tools & Resources: Hospitals


General Hospital Measures?
| Current | ||
|---|---|---|
Hospital Commitment to Health Equity | NA |
4 |
General Hospital Measures
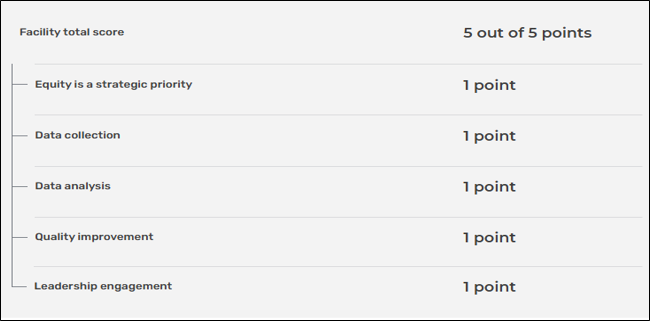
Hospital Commitment to Health Equity (Data Source: CMS Hospital Compare 01/01/2023 -- 12/31/2023)
This annual attestation measure from 2024 shows a hospital’s commitment to health equity for racial and ethnic minority groups, people with disabilities, members of the LGBTQ+ communities, people with limited English proficiency, rural populations, religious minorities, and people facing socioeconomic challenges. CMS has retired this measure but CA is still committed to care for vulnerable populations. The assessment of a hospital’s commitment to health equity is based upon 5 different domains of commitment based on the scoring criteria indicated in the table below:
Patient Experience?
| Current | ||||
|---|---|---|---|---|
Summary Star Rating | NA |
3 |
NA |
|
Patient Experience |
||||
Would Recommend Hospital | NA |
67% |
71% |
|
Received Information and Education | NA |
85% |
87% |
|
Nurses Communicated Well | NA |
75% |
80% |
|
Doctors Communicated Well | NA |
75% |
80% |
|
Help Received When Wanted | NA |
59% |
67% |
|
Staff Explained Medicine | NA |
57% |
62% |
|
Patient Understood Care | NA |
48% |
53% |
|
Patient Room and Bathroom Was Clean | NA |
72% |
74% |
|
Quiet at Night | NA |
49% |
62% |
|
Patient Experience
Summary Star Rating (Data Source: CMS Hospital Compare 01/01/2024 -- 12/31/2024)
The “Summary Star Rating” combines information about different aspects of patient experience to make it easier for consumers to compare hospitals. The Summary Star Rating is the average of 11 HCAHPS measures: Nurse communication, doctor communication, responsiveness of hospital staff, pain management, communication about medicines, discharge information, care transition, cleanliness, quietness, overall hospital rating, and whether or not the patient would recommend the hospital.
Patient Experience (Data Source: CMS Hospital Compare 01/01/2024 -- 12/31/2024)
This section shows how the hospital was scored by patients for nine of the eleven HCAHPS measures used for the Summary Star Rating.
- Would recommend hospital: Patients were asked whether they would recommend this hospital to friends and family. The higher the percentage shown, the more likely that they would recommend it.
- Received information and education: Patients need information about their care to make informed decisions. This measure shows how well providers answered questions about a patient’s condition, the drugs given, or what to expect after leaving the hospital.
- Nurses communicated well: This measure shows the percentage of patients who responded that their nurses “always” communicated well.
- Doctors communicated well: This measure shows the percentage of patients who responded that their doctors “always” communicated well.
- Help received: This measure shows the percentage of patients who responded that they “always” received help as soon as they wanted.
- Staff explained medicine: This measure shows the percentage of patients who responded that staff “always” explained about their medicines before giving it to them.
- Patient Understood Care: This measure shows the percentage of patients who strongly agree that they understood their care when they left the hospital.
- Patient room and bathroom was clean: This measure shows the percentage of patients who responded that their room and bathroom were “always” clean.
- Quiet at night: This measure shows the percentage of patients who responded that the area around their room was “always” quiet at night.
Re-Hospitalizations?
| Current | |||
|---|---|---|---|
Hospitalwide Readmission Rate | NA |
14.7% (lower is better) |
14.6% (lower is better) |
Re-Hospitalizations
Hospitalwide Readmission Rate (Data Source: CMS Hospital Compare 07/01/2022 -- 06/30/2023)
This readmission rate is the percentage of patients who returned to the hospital within 30 days for any reason. Lower rates suggest better quality of care. A readmission or re-hospitalization may result from incomplete treatment or poor care by the hospital team of the underlying problem, or may reflect poor coordination of care by the hospital team at the time of discharge and afterward. Readmission rates can vary for many reasons and may not always indicate a hospital’s level of quality. Note that this readmission rate is based on data reported by CMS Hospital Compare and, while measured the same way for all hospitals, may be measured differently than readmission rates for other conditions. Importantly, the data are based on the Medicare fee-for-service population, which has higher readmission rates than the general population.
See ratings on health care quality in hospitals, why quality matters to you, and how you can help get the care you need and deserve.
Tools & Resources: Hospitals
Patient Experience?
| Current | ||||
|---|---|---|---|---|
Summary Star Rating | NA |
3 |
NA |
|
Patient Experience |
||||
Would Recommend Hospital | NA |
67% |
71% |
|
Received Information and Education | NA |
85% |
87% |
|
Nurses Communicated Well | NA |
75% |
80% |
|
Doctors Communicated Well | NA |
75% |
80% |
|
Help Received When Wanted | NA |
59% |
67% |
|
Staff Explained Medicine | NA |
57% |
62% |
|
Patient Understood Care | NA |
48% |
53% |
|
Patient Room and Bathroom Was Clean | NA |
72% |
74% |
|
Quiet at Night | NA |
49% |
62% |
|
Patient Experience
Summary Star Rating (Data Source: CMS Hospital Compare 01/01/2024 -- 12/31/2024)
The “Summary Star Rating” combines information about different aspects of patient experience to make it easier for consumers to compare hospitals. The Summary Star Rating is the average of 11 HCAHPS measures: Nurse communication, doctor communication, responsiveness of hospital staff, pain management, communication about medicines, discharge information, care transition, cleanliness, quietness, overall hospital rating, and whether or not the patient would recommend the hospital.
Patient Experience (Data Source: CMS Hospital Compare 01/01/2024 -- 12/31/2024)
This section shows how the hospital was scored by patients for nine of the eleven HCAHPS measures used for the Summary Star Rating.
- Would recommend hospital: Patients were asked whether they would definitely recommend this hospital to friends and family. The higher the percentage shown, the more likely that they would recommend it.
- Received information and education: Patients need information about their care to make informed decisions. This measure shows how well providers answered questions about what to do during their recovery at home.
- Nurses communicated well: This measure shows the percentage of patients who responded that their nurses “always” communicated well.
- Doctors communicated well: This measure shows the percentage of patients who responded that their doctors “always” communicated well.
- Help received: This measure shows the percentage of patients who responded that they “always” received help as soon as they wanted.
- Staff explained medicine: This measure shows the percentage of patients who responded that staff “always” explained about their medicines before giving it to them.
This measure reflects patients who “strongly agree” they understood their care when they left the hospital.
- Patient room and bathroom was clean: This measure shows the percentage of patients who responded that their room and bathroom were “always” clean.
- Quiet at night: This measure shows the percentage of patients who responded that the area around their room was “always” quiet at night.
See ratings on health care quality in hospitals, why quality matters to you, and how you can help get the care you need and deserve.
Tools & Resources: Hospitals
Mother and Baby?
| Current | |||
|---|---|---|---|
Cesarean Birth Rate | NA |
24.9% (lower is better) |
NA |
Episiotomy Rate | NA |
2.5% (lower is better) |
NA |
VBAC Routinely Available | NA |
NA |
NA |
VBAC Rate | NA |
19.2% |
NA |
Deliveries by Certified Nurse Midwives | NA |
13.8% |
NA |
Baby Friendly Designated Hospital | NA |
NA |
NA |
Mother and Baby
Cesarean Birth Rate (Data Source: CMQCC 07/01/2024 -- 06/30/2025)
This measure reflects the percentage of cesarean births among mothers whose pregnancies were nulliparous, term, singleton and vertex (NTSV) — which means the delivery of a single baby [versus twins or triplets] in a head-down position after 37 weeks gestational age to women having their first baby. Unless there is a specific medical complication, cesareans should be avoided in this relatively low-risk population.
For the baby, cesareans are associated with a higher risk of respiratory issues that require admission to an intensive care unit. For mothers, cesareans carry an increased risk of complications such as post-surgical infection and hemorrhage. Compared to vaginal birth, cesareans are also associated with longer recovery times and can impede the mother-infant breastfeeding relationship. Importantly, women with prior cesarean births also have significantly higher risks of complications in their subsequent pregnancies.
Hospitals with an NTSV Cesarean Birth rate higher than 23.6% are performing cesareans above the statewide target. A woman who prefers a vaginal birth for her first baby should look for a hospital with a low NTSV C-section rate and discuss her delivery options with her maternity care provider.
The NTSV Cesarean Birth rate compares how often each hospital performs cesareans on its patients with relatively “low risk” pregnancies. However, this measure does not adjust for every single medical complication that may lead a physician to recommend a cesarean. As such, hospitals that routinely treat very high-risk patients may have higher cesarean birth rates.
Episiotomy Rate (Data Source: CMQCC 07/01/2024 -- 06/30/2025)
An episiotomy is a surgical cut in the vaginal opening to make more space for the birth of a baby. It was once a routine procedure; however, many recent studies show that this cut does not make the birth easier and actually may lead to more short- and long-term harm in women. Providers and hospitals generally aim to do fewer episiotomies.
This measure reflects the number of episiotomies performed on women delivering vaginally at the hospital (but excludes cases of shoulder dystocia—when the baby’s shoulder position can impede delivery). In general, a lower rate is better.
VBAC Routinely Available (Data Source: CMQCC 01/01/2024 -- 12/31/2024)
Some women that had a cesarean in a prior delivery are interested in having the option to attempt a vaginal birth in their current pregnancy. This measure indicates whether a hospital has a policy of allowing “Vaginal Birth after Cesarean” (VBAC). Hospitals showing “yes” do offer VBAC services for eligible women who previously had cesareans.
This information was collected from a survey of hospitals conducted by the Hospital Quality Institute in 2016 and is regularly updated by the California Maternal Quality Care Collaborative upon hospital request. However, policies can change, so please contact the hospital directly to learn their current policy on VBACs.
VBAC Rate (Data Source: CMQCC 07/01/2024 -- 06/30/2025)
A Vaginal Birth after Cesarean section (“VBAC”) is when a woman who has had a prior C-section delivers vaginally in a subsequent pregnancy (that is, without needing a repeat C-section). There are situations where women who have had a prior C-section may be eligible to deliver future babies vaginally—which has fewer post-delivery complications.
This measure represents the percentage of vaginal births among all women with a prior C-section for each hospital. Note that this measure is based on all women delivering at the hospital who had a prior cesarean, and not just those actively seeking a VBAC or those deemed as good candidates for a VBAC.
Deliveries by Certified Nurse Midwives (Data Source: CMQCC 07/01/2024 -- 06/30/2025)
This statistic represents the percent of births at each hospital that were attended by Certified Nurse Midwives (CNMs). CNMs—often called “nurse-midwives”—are advanced practice nurses who are masters or doctorally educated and are licensed by the state to manage uncomplicated pregnancy and childbirth. The statistic is based on the provider type (e.g., physician, CNM, nurse) listed as the “Attending Provider” on all California Birth Certificates.
Some women have a personal preference to be attended by a CNM. Reporting each hospital’s CNM Delivery Rate can help women identify which hospitals have integrated CNMs into their maternity care unit. If you are interested in having your labor and birth attended by a nurse-midwife, contact the maternity unit at your preferred hospital(s) to identify the provider groups with CNMs.
Reporting Period for other Mother & Baby Measures (listed below):
These ratings reflect 07/01/2024 — 06/30/2025 hospital discharge and birth certificate data from 199 California hospitals that offer maternity services and participate in the CMQCC’s MDC. These 199 hospitals submitted data to the CMQCC Maternal Data Center to enable rapid-cycle reporting and quality improvement. One hospital listed in this section did not submit data to the CMQCC Maternal Data Center; their results represent Calendar Year 2022 data available from the California Department of Health Care Access and Information. This hospital is listed here.
For more information, please access the Ratings & Data Sources section of this website here.
Baby Friendly Designated Hospital (Data Source: Baby Friendly Website 01/01/2024 -- 12/31/2024)
Indicates if this maternity facility is designated as Baby Friendly. The World Health Organization (WHO) and the United Nations Children’s Fund (UNICEF) launched the Baby-Friendly Hospital Initiative (BFHI), a global program to encourage the broad-scale implementation of the Ten Steps to Successful Breastfeeding and the International Code of Marketing of Breast-milk Substitutes. The BFHI assists hospitals in giving mothers the information, and skills necessary to successfully initiate and continue breastfeeding their babies and gives special recognition to hospitals that have done so.
This designation process lasts for 5 years. We encourage individuals to check out the BF USA website for the most up to date information.
Hospitals must pay for this designation, as this is just one indicator of a hospital’s commitment to breastfeeding.
See ratings on health care quality in hospitals, why quality matters to you, and how you can help get the care you need and deserve.
Tools & Resources: Hospitals
Hip & Knee?
| Current | |||
|---|---|---|---|
Hip or Knee Surgery Readmission Rate | NA |
4.7% (lower is better) |
4.8% (lower is better) |
Hip or Knee Surgery Complication Rate | NA |
4% (lower is better) |
3.6% (lower is better) |
Hip & Knee
Hip or Knee Surgery Readmission Rate (Data Source: CMS Hospital Compare 07/01/2021 -- 06/30/2024)
This readmission rate is the percentage of patients who returned to the hospital within 30 days after hip or knee surgery. Lower rates suggest better quality of care. A readmission may result from incomplete treatment or poor care by the hospital team of the underlying problem, or may reflect poor coordination of care by the hospital team at the time of discharge and afterward. Readmission rates can vary for many reasons and may not always indicate a hospital’s level of quality. Note that this readmission rate is based on data reported by CMS Hospital Compare and, while measured the same way for all hospitals, may be measured differently than readmission rates for other conditions. Importantly, the data are based on the Medicare fee-for-service population, which has higher readmission rates than the general population.
Hip or Knee Surgery Complication Rate (Data Source: CMS Hospital Compare 04/01/2021 -- 03/31/2024)
This complication rate is the percent of patients who electively had a primary total hip/knee replacement and developed at least one of eight complications: heart attack, pneumonia, sepsis/septicemia/shock, surgical site bleeding, pulmonary embolism, death, mechanical complication with the joint, or joint/wound infection. A complication may result from incomplete treatment or poor care by the hospital team or may reflect poor coordination of care by the hospital team at the time of discharge and afterward. Complication rates can vary for many reasons and may not always indicate a hospital’s level of quality. The data are based on the Medicare fee-for-service population.
See ratings on health care quality in hospitals, why quality matters to you, and how you can help get the care you need and deserve.
Tools & Resources: Hospitals
Patient Safety?
| Current | ||||
|---|---|---|---|---|
Complication Prevention |
||||
Unplanned Surgical Wound Reopening | NA |
0.18% (lower is better) |
0.18% (lower is better) |
|
Death after Serious Treatable Complication | NA |
17% (lower is better) |
17.3% (lower is better) |
|
Accidental Lung Puncture | NA |
0.02% (lower is better) |
0.02% (lower is better) |
|
Healthcare Workers Given Influenza Vaccination | NA |
70% |
78% |
|
Sepsis Management | NA |
68% |
64% |
|
Safe Use of Opioids | NA |
14% (lower is better) |
15% (lower is better) |
|
Patient Safety
Complication Prevention (Data Source: CMS Hospital Compare 01/01/2024 -- 12/31/2024)
Unplanned Surgical Wound Reopening (Data Source: CMS Hospital Compare 07/01/2022 -- 06/30/2024)
The medical term for this is “postoperative wound dehiscence.” An unplanned reopening of a surgical wound is a complication of surgery. This reopening usually occurs between seven and ten days after surgery and often leads to infection and sometimes even death if left untreated. The causes of wound reopening depend on the type of surgery but include infection of the wound, pressure on the stitches, stitches that are too tight, poor wound closing, and injury to the wound after closure. Signs of potential problems with a wound can include pain, bruising, inflammation, discharge, and breakdown of the skin around the wound area, as well as diarrhea, fever, and vomiting. Patients should check their wound site regularly and alert the surgeon or physician if it is not healing. Lower rates suggest better quality of care.
Death after Serious Treatable Complication (Data Source: CMS Hospital Compare 07/01/2022 -- 06/30/2024)
This measure shows the percentage of patients who died after developing a medical complication following inpatient surgery. Some hospitals are better than others at quickly identifying these complications and treating them aggressively. Lower death rates suggest better quality of care.
Accidental Lung Puncture (Data Source: CMS Hospital Compare 07/01/2022 -- 06/30/2024)
The medical term for this is “iatrogenic pneumothorax.” The problem occurs when the cavity between the lungs and the chest wall is accidentally punctured during a required medical procedure (for example, by a needle being used to give the patient medicine). The puncture causes air to leak into the body and may lead to lung collapse. Lower rates suggest better quality of care.
Healthcare Workers Given Influenza Vaccination (Data Source: CMS Hospital Compare 10/01/2024 -- 03/31/2025)
The percentage of healthcare workers who were given the influenza vaccination.
Sepsis Management (Data Source: CMS Hospital Compare 01/01/2024 -- 12/31/2024)
Sepsis Infection: This measure shows the percentage of patients who received appropriate care for severe sepsis and septic shock. This sepsis bundle measure examines six different types of care for patients with sepsis. A hospital must complete all six to be counted as delivering appropriate care to patients.
Safe Use of Opioids (Data Source: CMS Hospital Compare 01/01/2024 -- 12/31/2024)
When prescription opioids, or opioids and benzodiazepines are given at the same time, patients are at a higher risk of unintentional overdose because of the increased risk of breathing problems. Not using both types of medications at the same time reduces the risk of ER and inpatient hospital stays.
See ratings on health care quality in hospitals, why quality matters to you, and how you can help get the care you need and deserve.
Tools & Resources: Hospitals
Antibiotic-Resistant Infections?
| Current | |||
|---|---|---|---|
MRSA Bloodstream Infections | NA |
1 (lower is better) |
1 (lower is better) |
C.diff Lab Identified Events (intestinal infections) | NA |
1 (lower is better) |
1 (lower is better) |
Antibiotic-Resistant Infections
Antibiotic-Resistant Infections (Data Source: CMS Hospital Compare 01/01/2024 -- 12/31/2024)
Bloodstream infections (BSIs) are among the most serious health care-associated infections and can lead to death, longer hospital stays, and additional costs.
MRSA Infection: Methicillin-resistant Staphylococcus aureus (MRSA) is a bloodstream infection Staph resistant to certain antibiotics. This measure shows the number of events identified by the lab.
C.diff Infection: This measure shows the number of C.diff events identified by the lab.
Infections Related to Catheters and Tubes?
| Current | |||
|---|---|---|---|
Central Line-Associated Bloodstream Infections in ICUs and Select Wards | NA |
1 (lower is better) |
1 (lower is better) |
Catheter-Associated Urinary Tract Infections in ICUs and Select Wards | NA |
1 (lower is better) |
1 (lower is better) |
Surgical Site Infections - Cardiovascular & Thoracic?
| Current | |||
|---|---|---|---|
Abdominal Aortic Aneurysm Repair | NA |
1 (lower is better) |
NA |
Cardiac | NA |
1 (lower is better) |
NA |
CABG with Chest and Donor Site Incision | NA |
1 (lower is better) |
NA |
CABG with Chest Incision Only | NA |
1 (lower is better) |
NA |
Thoracic | NA |
1 (lower is better) |
NA |
Surgical Site Infections - Cardiovascular & Thoracic
Surgical Site Infections - Cardiovascular & Thoracic (Data Source: CDPH 01/01/2024 -- 12/31/2024)
Surgical Site Infections (SSIs) occur after surgery in the part of the body where the surgery took place. Some are superficial infections, while others are more serious and can involve muscle and other tissues under the skin, organs, or the space around organs, which often result in longer hospital stays or readmissions later. Surgical site infections may be prevented with proper preparation of the skin and administration of an antibiotic just prior to surgery. SSIs are shown in six categories: Cardiovascular & Thoracic, Gastrointestinal, Orthopedic, OB/GYN, Gallbladder/Liver Related, and Organ Transplant.
Surgical Site Infections - Gastrointestinal?
| Current | |||
|---|---|---|---|
Appendix | NA |
1 (lower is better) |
NA |
Colon | NA |
1 (lower is better) |
1 (lower is better) |
Gastric | NA |
1 (lower is better) |
NA |
Rectal | NA |
1 (lower is better) |
NA |
Small Bowel | NA |
1 (lower is better) |
NA |
Surgical Site Infections - Gastrointestinal
Surgical Site Infections (SSIs) occur after surgery in the part of the body where the surgery took place. Some are superficial infections, while others are more serious and can involve muscle and other tissues under the skin, organs, or the space around organs, which often result in longer hospital stays or readmissions later. Surgical site infections may be prevented with proper preparation of the skin and administration of an antibiotic just prior to surgery. SSIs are shown in six categories: Cardiovascular & Thoracic, Gastrointestinal, Orthopedic, OB/GYN, Gallbladder/Liver Related, and Organ Transplant.
Appendix (Data Source: CDPH 01/01/2024 -- 12/31/2024)
Colon (Data Source: CMS Hospital Compare 01/01/2024 -- 12/31/2024)
Gastric (Data Source: CDPH 01/01/2024 -- 12/31/2024)
Rectal (Data Source: CDPH 01/01/2024 -- 12/31/2024)
Small Bowel (Data Source: CDPH 01/01/2024 -- 12/31/2024)
Surgical Site Infections - Orthopedic?
| Current | |||
|---|---|---|---|
Hip Prosthesis | NA |
1 (lower is better) |
NA |
Knee Prosthesis | NA |
1 (lower is better) |
NA |
Laminectomy | NA |
1 (lower is better) |
NA |
Open Reduction of Fracture | NA |
1 (lower is better) |
NA |
Spinal Fusion | NA |
1 (lower is better) |
NA |
Surgical Site Infections - Orthopedic
Surgical Site Infections - Orthopedic (Data Source: CDPH 01/01/2024 -- 12/31/2024)
Surgical Site Infections (SSIs) occur after surgery in the part of the body where the surgery took place. Some are superficial infections, while others are more serious and can involve muscle and other tissues under the skin, organs, or the space around organs, which often result in longer hospital stays or readmissions later. Surgical site infections may be prevented with proper preparation of the skin and administration of an antibiotic just prior to surgery. SSIs are shown in six categories: Cardiovascular & Thoracic, Gastrointestinal, Orthopedic, OB/GYN, Gallbladder/Liver Related, and Organ Transplant.
Surgical Site Infections - OB/GYN?
| Current | |||
|---|---|---|---|
Cesarean Section | NA |
1 (lower is better) |
NA |
Abdominal Hysterectomy | NA |
1 (lower is better) |
1 (lower is better) |
Surgical Site Infections - OB/GYN
Surgical Site Infections - OB/GYN (Data Source: CDPH 01/01/2024 -- 12/31/2024)
Surgical Site Infections (SSIs) occur after surgery in the part of the body where the surgery took place. Some are superficial infections, while others are more serious and can involve muscle and other tissues under the skin, organs, or the space around organs, which often result in longer hospital stays or readmissions later. Surgical site infections may be prevented with proper preparation of the skin and administration of an antibiotic just prior to surgery. SSIs are shown in six categories: Cardiovascular & Thoracic, Gastrointestinal, Orthopedic, OB/GYN, Gallbladder/Liver Related, and Organ Transplant.
Surgical Site Infections - Gallbladder/Liver Related?
| Current | |||
|---|---|---|---|
Bile Duct/Liver/Pancreatic | NA |
1 (lower is better) |
NA |
Gallbladder | NA |
1 (lower is better) |
NA |
Surgical Site Infections - Organ Transplant?
| Current | |||
|---|---|---|---|
Kidney Transplant | NA |
1 (lower is better) |
NA |
Liver Transplant | NA |
1 (lower is better) |
NA |
Surgical Site Infections - Organ Transplant
Surgical Site Infections - Organ Transplant (Data Source: CDPH 01/01/2024 -- 12/31/2024)
Surgical Site Infections (SSIs) occur after surgery in the part of the body where the surgery took place. Some are superficial infections, while others are more serious and can involve muscle and other tissues under the skin, organs, or the space around organs, which often result in longer hospital stays or readmissions later. Surgical site infections may be prevented with proper preparation of the skin and administration of an antibiotic just prior to surgery. SSIs are shown in six categories: Cardiovascular & Thoracic, Gastrointestinal, Orthopedic, OB/GYN, Gallbladder/Liver Related, and Organ Transplant.
See ratings on health care quality in hospitals, why quality matters to you, and how you can help get the care you need and deserve.
Tools & Resources: Hospitals
Emergency Department (ED) Care?
| Current | |||
|---|---|---|---|
Time in ED before being sent home | NA |
186 minutes (lower is better) |
161 minutes (lower is better) |
Left the ED before being seen | NA |
2.39% (lower is better) |
2% (lower is better) |
Emergency Department (ED) Care
Time in ED before being sent home (Data Source: CMS Hospital Compare 01/01/2024 -- 12/31/2024)
The page shows the average amount of time patients spend in the emergency department before being sent home.
Left the ED before being seen (Data Source: CMS Hospital Compare 01/01/2023 -- 12/31/2023)
This measure shows the percentage of patients who left the emergency department without being seen by a provider.
See ratings on health care quality in hospitals, why quality matters to you, and how you can help get the care you need and deserve.
Tools & Resources: Hospitals
Heart Attack?
| Current | |||
|---|---|---|---|
Death Rate | NA |
11.9% (lower is better) |
12.2% (lower is better) |
Readmission Rate | NA |
13.8% (lower is better) |
13.6% (lower is better) |
Heart Attack
Death Rate (Data Source: CMS Hospital Compare 07/01/2021 -- 06/30/2024)
This measure estimates the patients who died from any cause within 30 days of being hospitalized for heart attack, regardless of whether the death was in the hospital or after discharge. Note that this death rate is based on data reported by CMS/Medicare and, while measured the same way for all hospitals, may be measured differently than death rates for other conditions. Importantly, the data are based on the Medicare fee-for-service population, which has higher death rates than the general population.
Readmission Rate (Data Source: CMS Hospital Compare 07/01/2021 -- 06/30/2024)
This readmission rate is the percentage of patients who returned to the hospital within 30 days for any reason. Lower rates suggest better quality of care. A readmission may result from incomplete treatment or poor care by the hospital team of the underlying problem, or may reflect poor coordination of care by the hospital team at the time of discharge and afterward. Readmission rates can vary for many reasons and may not always indicate a hospital’s level of quality. Note that this readmission rate is based on data reported by CMS Hospital Compare and, while measured the same way for all hospitals, may be measured differently than readmission rates for other conditions. Importantly, the data are based on the Medicare fee-for-service population, which has higher readmission rates than the general population.
Heart Bypass Surgery?
| Current | |||
|---|---|---|---|
CABG Death Rate - With Valve | NA |
5.4% (lower is better) |
NA |
Postoperative Stroke | NA |
1.4% (lower is better) |
NA |
Heart Bypass Surgery
CABG Death Rate - With Valve (Data Source: HCAI 01/01/2022 -- 12/31/2023)
This measure shows the percentage of patients who died within 30 days of discharge after heart bypass surgery that includes aortic valve replacement, mitral valve replacement or repair, or a combination thereof. The rate is adjusted because patients have different chances of dying due to individual risk factors. Lower rates suggest better quality of care. Note that this death rate is based on data reported by California CABG Outcomes Reporting Program (CCORP) / California OSHPD and, while measured the same way for all hospitals, may be measured differently than death rates for other conditions.
Postoperative Stroke (Data Source: HCAI 01/01/2022 -- 12/31/2023)
This measure shows the percentage of patients who suffered a stroke after they had heart bypass surgery.
Heart Failure?
| Current | |||
|---|---|---|---|
Death Rate | NA |
10.7% (lower is better) |
11.6% (lower is better) |
Readmission Rate | NA |
20% (lower is better) |
19.7% (lower is better) |
Heart Failure
Death Rate (Data Source: CMS Hospital Compare 07/01/2021 -- 06/30/2024)
This measure estimates the patients who died from any cause within 30 days of being hospitalized for heart failure, regardless of whether the death was in the hospital or after discharge. Note that this death rate is based on data reported by CMS/Medicare and, while measured the same way for all hospitals, may be measured differently than death rates for other conditions. Importantly, the data are based on the Medicare fee-for-service population, which has higher death rates than the general population.
Readmission Rate (Data Source: CMS Hospital Compare 07/01/2021 -- 06/30/2024)
This readmission rate is the percentage of patients who returned to the hospital within 30 days for any reason. Lower rates suggest better quality of care. A readmission may result from incomplete treatment or poor care by the hospital team of the underlying problem, or may reflect poor coordination of care by the hospital team at the time of discharge and afterward. Readmission rates can vary for many reasons and may not always indicate a hospital’s level of quality. Note that this readmission rate is based on data reported by CMS Hospital Compare and, while measured the same way for all hospitals, may be measured differently than readmission rates for other conditions. Importantly, the data are based on the Medicare fee-for-service population, which has higher readmission rates than the general population.
Pneumonia?
| Current | |||
|---|---|---|---|
Death Rate | NA |
15.4% (lower is better) |
16.2% (lower is better) |
Readmission Rate | NA |
16.4% (lower is better) |
16% (lower is better) |
Pneumonia
Death Rate (Data Source: CMS Hospital Compare 07/01/2021 -- 06/30/2024)
This measure estimates the patients who died from any cause within 30 days of being hospitalized for pneumonia, regardless of whether the death was in the hospital or after discharge. Note that this death rate is based on data reported by CMS/Medicare and, while measured the same way for all hospitals, may be measured differently than death rates for other conditions. Importantly, the data are based on the Medicare fee-for-service population, which has higher death rates than the general population.
Readmission Rate (Data Source: CMS Hospital Compare 07/01/2021 -- 06/30/2024)
This readmission rate is the percentage of patients who returned to the hospital within 30 days for any reason. Lower rates suggest better quality of care. A readmission may result from incomplete treatment or poor care by the hospital team of the underlying problem, or may reflect poor coordination of care by the hospital team at the time of discharge and afterward. Readmission rates can vary for many reasons and may not always indicate a hospital’s level of quality. Note that this readmission rate is based on data reported by CMS Hospital Compare and, while measured the same way for all hospitals, may be measured differently than readmission rates for other conditions. Importantly, the data are based on the Medicare fee-for-service population, which has higher readmission rates than the general population.
Chronic Obstructive Pulmonary Disease (COPD)?
| Current | |||
|---|---|---|---|
Death Rate | NA |
8.5% (lower is better) |
8.8% (lower is better) |
Readmission Rate | NA |
18.2% (lower is better) |
18.2% (lower is better) |
Chronic Obstructive Pulmonary Disease (COPD)
Death Rate (Data Source: CMS Hospital Compare 07/01/2021 -- 06/30/2024)
This measure estimates the patients who died from any cause within 30 days of being hospitalized for COPD, regardless of whether the death was in the hospital or after discharge. Note that this death rate is based on data reported by CMS/Medicare and, while measured the same way for all hospitals, may be measured differently than death rates for other conditions. Importantly, the data are based on the Medicare fee-for-service population, which has higher death rates than the general population.
Readmission Rate (Data Source: CMS Hospital Compare 07/01/2021 -- 06/30/2024)
This readmission rate is the percentage of patients who returned to the hospital within 30 days for any reason. Lower rates suggest better quality of care. A readmission may result from incomplete treatment or poor care by the hospital team of the underlying problem, or may reflect poor coordination of care by the hospital team at the time of discharge and afterward. Readmission rates can vary for many reasons and may not always indicate a hospital’s level of quality. Note that this readmission rate is based on data reported by CMS Hospital Compare and, while measured the same way for all hospitals, may be measured differently than readmission rates for other conditions. Importantly, the data are based on the Medicare fee-for-service population, which has higher readmission rates than the general population.
See ratings on health care quality in hospitals, why quality matters to you, and how you can help get the care you need and deserve.
Tools & Resources: Hospitals
Stroke?
| Current | |||
|---|---|---|---|
Death Rate | NA |
12.9% (lower is better) |
13.3% (lower is better) |
Stroke
Death Rate (Data Source: CMS Hospital Compare 07/01/2021 -- 06/30/2024)
This measure estimates the patients who died from any cause within 30 days of being hospitalized for a stroke, regardless of whether the death was in the hospital or after discharge. Note that this death rate is based on data reported by CMS/Medicare and, while measured the same way for all hospitals, may be measured differently than death rates for other conditions. Importantly, the data are based on the Medicare fee-for-service population, which has higher death rates than the general population.
See ratings on health care quality in hospitals, why quality matters to you, and how you can help get the care you need and deserve.
Tools & Resources: Hospitals
Psychiatric Care?
| Current | |||
|---|---|---|---|
Percent of patients receiving follow-up care within 30 days after hospitalization for mental illness | NA |
57% |
NA |
Percent of patients receiving follow-up care within 7 days after hospitalization for mental illness | NA |
36% |
NA |
Hours of physical-restraint use | NA |
0.70 (lower is better) |
NA |
Hours of seclusion use | NA |
0.60 (lower is better) |
NA |
Medication Continuation Following Inpatient Psychiatric Discharge | NA |
78% |
NA |
Transition record with specified elements received by discharged patients | NA |
60% |
NA |
Psychiatric Care
Percent of patients receiving follow-up care within 30 days after hospitalization for mental illness (Data Source: CMS Hospital Compare 07/01/2022 -- 06/30/2023)
The percentage of discharges for which the patient received follow-up within 30 days after discharge for patients 6 years of age and older who were hospitalized for treatment of selected mental illness or intentional self-harm diagnoses and who had a follow-up visit with a mental health provider.
Percent of patients receiving follow-up care within 7 days after hospitalization for mental illness (Data Source: CMS Hospital Compare 07/01/2022 -- 06/30/2023)
The percentage of discharges for which the patient received follow-up within 7 days after discharge for patients 6 years of age and older who were hospitalized for treatment of selected mental illness or intentional self-harm diagnoses and who had a follow-up visit with a mental health provider.
Hours of physical-restraint use (Data Source: CMS Hospital Compare 01/01/2023 -- 12/31/2023)
The total number of hours that all patients admitted to a hospital-based inpatient psychiatric setting were maintained in physical restraint per 1000 hours of all patients admissions.
Hours of seclusion use (Data Source: CMS Hospital Compare 01/01/2023 -- 12/31/2023)
The total number of hours that all patients admitted to a hospital-based inpatient psychiatric setting were held in seclusion per 1000 hours of all patients admissions.
Medication Continuation Following Inpatient Psychiatric Discharge (Data Source: CMS Hospital Compare 07/01/2021 -- 06/30/2023)
This measure shows the percentage of patients admitted to an inpatient psychiatric facility for serious mental illness who filled at least one prescription between the 2 days before they were discharged and 30 days after they were discharged from the facility.
Transition record with specified elements received by discharged patients (Data Source: CMS Hospital Compare 01/01/2023 -- 12/31/2023)
This measure assesses the percentage of patients discharged from an inpatient psychiatric facility who received (or whose caregiver received) a complete record of inpatient psychiatric care and plans for follow-up.